


Frequency-Domain characterization of FR-4 dielectric using Djordjevic-Sarkar algorithm1 May 2020
Introduction
I must admit that this topic was not on the list of future blog posts and is something I stumbled upon while investigating the limitation of the parallel-plate approximation formula for the capacitance of two planes separated by a dielectric material, a future topic of interest on our blog. However, our focus is directed today on something different, the variation of the dielectric constant of a material with frequency. This matter could at first sound strange and in contradiction with its name of "constant". Moreover, if we think of the dielectric constant as the factor that determines the capacitance of a parallel-plate capacitor we obtain a frequency dependent capacitance for the corresponding structure, once again a counter-intuitive effect. However, this variation is explained by the molecular effects inside the dielectric material [2] and was also investigated in an IEEE Transactions on Electromagnetic Compatibility paper in 2001 by Antonije R. Djordjevic´ and Tapan K. Sarkar [1]. In this paper the variation of the dielectric constant with frequency was characterized using a simple formula which requires a minimum of 4 input parameters. ANSYS products HFSS and Q3D can use this formula for dielectric materials if the corresponding setting is made.
Why is capacitance of interest to discuss and investigate? To start with, almost every interconnect from the signal and power integrity field can be characterized as a simple RLCG model at least as a first order model where the C stands for "capacitance". Simple numerical approximations can be applied but like every approximation these formulas have limitations which are of interest to be known. When the limitations of these formulas are reached, specific electromagnetic tools such as ANSYS HFSS or Q3D must be used. One such approximation is the capacitance between two parallel plates separated by a dielectric material which requires as input data the geometric aspect of the structure, the vacuum permittivity and lastly the dielectric constant of the material. As mentioned before, this constant is slightly dependent of frequency and for the proper use of the parallel-plate approximation at a specific frequency the corresponding dielectric constant value should be used. In this article I investigate how ANSYS Q3D and by extension its 2D Extractor version take into account this variation in accordance with the equations proposed by Antonije R. Djordjevic´ and Tapan K. Sarkar in [1].
Materials and Methods
The dielectric constant of a material describes how it multiplies the capacitance of a planar capacitor when inserted between its two plates and how it decreases the speed of light (v = c/sqrt(ε)). In an ideal case, no DC current is flowing between the plates, the dielectric is considered to a perfect insulator and the AC current leads the voltage by 90 degrees. However, ideal cases are only textbook materials and when a real dielectric material with a certain electric conductivity different from zero is used, both a small DC current corresponding to the bulk conductivity and also an AC current in phase with the voltage are present into the capacitor.
The dielectric constant is defined as a complex number described by Equation 1. In this way, the real part of the complex number is the one that describes the ideal desired effect of the dielectric, that of increasing the capacitance of a capacitor by a factor equal with ε´ and the imaginary part is the one describing the losses in the dielectric proportional with ε´´. The losses consist of current which is exactly in phase with the voltage, losses modeled as a conductance in parallel with the capacitance, this being also the reason why in this formalism the complex number ε has its imaginary part defined with a minus sign. Last but not least, I should mention that the real part ε´ is the one we usually hear about and which is simply referred as ε along with tan(δ) which is nothing else than the tangent of the δ angle made by the complex number with the abscissa as observed in Figure 1. With these two figures of interest, the imaginary part of the number is referred as ε·tan(δ). These three naming conventions are also used in this article.
 Equation 1: Dielectric complex permitivity
 Figure 1: The dielectric constant of a material is described as a complex number with the
real part ε´ usually simply called ε and the imaginary part named ε·tan(δ)
where δ is the angle between the complex number and the abscissa. Extract from [2].
Figure 1: The dielectric constant of a material is described as a complex number with the
real part ε´ usually simply called ε and the imaginary part named ε·tan(δ)
where δ is the angle between the complex number and the abscissa. Extract from [2]."A material may have several dielectric mechanisms or polarization effects that contribute to its overall permittivity such as described in Figure 2. A dielectric material has an arrangement of electric charge carriers that can be displaced by an electric field. The charges become polarized to compensate for the electric field such that the positive and negative charges move in opposite directions"[2]. Dipole orientation and ionic conduction are the ones interacting strongly at microwave frequencies. These two mechanisms are quite lossy (this is the reason why food heats up in a microwave oven because water has a strong dipolar effect). "Each dielectric mechanism has a characteristic cutoff frequency. As frequency increases, the slow mechanisms drop out in turn, leaving the faster ones to contribute to ε´. The loss factor ε´´ will correspondingly peak at each critical frequency. The magnitude and cutoff frequency of each mechanism is unique for different materials. [...] Teflon, on the other hand, has no dipolar mechanisms and its permittivity is remarkably constant well into the millimeter-wave region"[2]. Electronic and atomic polarization occur at frequencies above practical values of interest and are beyond the scope of this article.
Ionic conduction is the dominant mechanism for DC currents. The reason the DC current (also known as leakage current) is low in most insulators is that the density of mobile charge carriers (ions in the case of most insulators) is very small and their mobility is so low. In comparison, in a metal there is a high density of free electrons which have a very high mobility. The orientation of permanent electric dipoles in the material causes a motion of the negative end of the dipole toward the positive electrode and the positive end of the dipole to the negative electrode which looks like a transient current through the material and is in fact the source of losses in the microwave frequency range [3].
The dissipation factor tan(δ) of a material is a property which measures the number of dipoles in the material and how far each of them can rotate in the applied field. The dissipation factor has the expression from Equation 2 where σ is the bulk AC conductivity of the dielectric and ε0 is the vacuum permittivity equal with 8.89·10E-14 F/m.
 Equation 2: Dissipation factor definition
The losses in the dielectric material can also be understood as dipoles that are moving too slow to keep up with the electric field being applied to the dielectric material. The relaxation time as a measure of the mobility of molecules (dipoles) of the material can be defined as the time required for a displaced system aligned in an electric field to return to its random equilibrium value. The relaxation frequency fc is related inversely to the relaxation time τ by the formula τ = 1/(2·π·fc). This can be interpreted in the following way: below the relaxation frequency the dipoles are able to keep pace with the field variation and above it, the electric field is too fast to influence the dipole rotation [2]. These effects are influencing the real and imaginary part of the dielectric constant of materials, as already discussed and also observed in Figure 2.
 Figure 2: Frequency response of dielectric mechanisms. Dipole orientation interact in the
microwave region of interest for circuit boards dielectrics. Extract from [2].
Figure 2: Frequency response of dielectric mechanisms. Dipole orientation interact in the
microwave region of interest for circuit boards dielectrics. Extract from [2].We can now describe the capacitance between two parallel plates as a simple CG parallel circuit where the C is the desired capacitance described by ε and G models the parasitic effect characterized by the dissipation factor, tan(δ). The capacitance can be calculated using the parallel plate formula from Equation 3 where A/h is the area of the plates divided by the height of the dielectric while the conductance has the expression from Equation 4 where ω is the angular frequency.
 Equation 3: Parallel-plate approximation formula
 Equation 4: Conductance formula
Antonije R. Djordjevic´ and Tapan K. Sarkar published in 2001 in IEEE Transactions on Electromagnetic Compatibility the paper "Wideband Frequency-Domain Characterization of FR-4 and Time-Domain Causality" [1] which offered an analytical approach for easily predicting the dielectric constant and the dissipation factor of a dielectric material with a minimum of initial data required. Based on a wideband measurement for these two parameters, they observed the variations from Figure 3 where three frequencies intervals stand up. These three intervals are called DC, transition and optical as seen in Figure 4 and are characterized by different variations for our parameters of interest.
Displayed in Figure 4, the transitioning interval is delimited by the angular frequencies ωA and ωB (and their corresponding frequencies fA and fB). The frequency at which the manufacturers usually make the measurement of the dielectric constant and the dissipation factor is noted as f1 and must be much lower than fB. Notice from Figure 4 how ε has a variation of Δε between the two constant values of εDC in the DC interval and ε∞ in the optical interval. According to Figure 3 we also expect a slightly variation of increase and decrease for the dissipation factor in the transition interval.
 Figure 3: ε´, ε´´ and tan(δ) variation with frequency from 10Hz to 10GHz. Extract from
[1] by Antonije R. Djordjevic´ and Tapan K. Sarkar published in IEEE Transactions on
Electromagnetic Compatibility in 2001.
Figure 3: ε´, ε´´ and tan(δ) variation with frequency from 10Hz to 10GHz. Extract from
[1] by Antonije R. Djordjevic´ and Tapan K. Sarkar published in IEEE Transactions on
Electromagnetic Compatibility in 2001. Figure 4: ε variation with frequency. The range is separated in three intervals by the lower
transition angular frequency named ωA and the higher transitioning angular frequency named
ωB. ω1 is the angular frequency where the ε and tan(δ) measurements are performed.
Figure 4: ε variation with frequency. The range is separated in three intervals by the lower
transition angular frequency named ωA and the higher transitioning angular frequency named
ωB. ω1 is the angular frequency where the ε and tan(δ) measurements are performed.Both ANSYS HFSS and Q3D use causal materials for lossy dielectric if this feature is enabled from the Design Settings menu, which results in the simulator automatically using the Djordjevic-Sarkar algorithm to estimate the dielectric constant and the dissipation factor for the dielectric material at the corresponding frequencies of interest. I now present what are the equations that the simulator uses to correctly predict the figures of interest.
First of all, starting from the Djordjevic-Sarkar method [1], the complex dielectric constant can be written in accordance with Equation 5 which can be approximated to the form from Equation 6. Notice in these two Equations the already discussed parameters, where ε1 is the real part of the complex dielectric constant at a certain f1 frequency. Furthermore, the complex dielectric permittivity from Equation 6 has the real and imaginary parts separated in Equation 7.
If we have in mind the definition from Equation 1 of the complex dielectric constant, we can equal the imaginary part of the complex dielectric constant with ε1·tan(δ), this leading to the relation from Equation 8. We note the fraction from Equation 9 with K followed by extracting exactly K from Equation 8 (this relation will come in handy). Lastly, we equal the real part of the complex dielectric constant from Equation 7 with ε1 using the K notation and we obtain the result displayed in Equation 10.
 Equation 5
 Equation 6
 Equation 7
 Equation 8
 Equation 9
 Equation 10
With all the mathematical equations in place, I now present an example set of values also used in the simulations from the following section. The minimum set of parameters you need to have to correctly estimate the figures of interest for a dielectric material with a Djordjevic-Sarkar frequency dependency are ε1 and tan(δ1) given at a specific frequency f1 and also the upper limit frequency fB. σDC and εDC are optional. In my example I considered the following values:
- ε1 = 4.4
- tan(δ1) = 0.02
- f1 = 1 GHz
- fB = 159 GHz
- σDC = 1E-12 S/m (can be considered by default 0)
- εDC = 5 (can be considered by default higher than ε∞)
I obtained from Equation 9 the value of 0.0562 for K. With K calculated, ε∞ resulted equal with 4.1149 from Equation 10. Consequently, since Δε = εDC - ε∞ I determined Δε = 0.8851. Lastly, from Equation 9, ωA is obtained leading to a lower limit frequency fA of 23.2991 kHz.
Simulation setup
Arriving at the main topic of this article, in order to investigate how ANSYS products apply the analytical equations from the Djordjevic-Sarkar method I opted for an electromagnetic simulation in Q3D extractor for a series of reasons now presented. Firstly, ANSYS Q3D inlcudes a 2D Extractor, the investigated structure being easily reduced to a 2D transversal section which considerably increased the precision of the mesh and decreased the simulation time. Secondly, as mentioned in the previous section, the parameters of interest were the C and G, exactly what 2D Extractor offers as a default result set. However, it is to be mentioned that Ansys Q3D and subsequently 2D Extractor are only quasi-static filed solvers which in this case posed no problem since transmission line effect were not of interest for this specific problem.
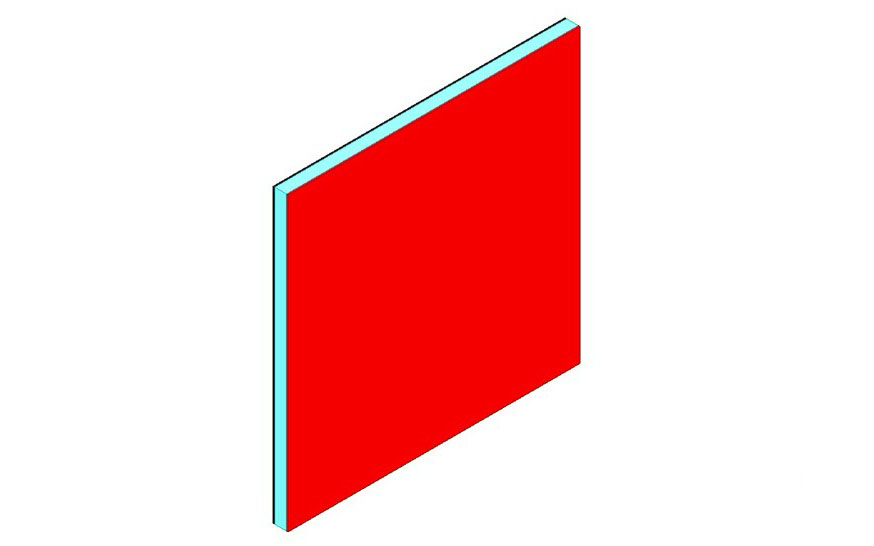
The studied structure is a simple parallel plate capacitor of 2 by 2 inches and a spacing of 20 MILs (0.020 inches) between the copper plates where the FR4 epoxy dielectric is placed. As observed in Figure 5, only the 2D transversal section of this capacitor was studied in the simulation. The results given by the simulator in a linear per unit length form were multiplied with the third dimension of the geometry, here of 2 inches. You can also observe in Figure 6 the air region enclosing the whole studied design. As I will discuss in a future blog post, the large size of 2 by 2 inches for this structure gives us the ability to proper estimate the capacitance using Equation 3 to a better than 1% error since fringing effect is negligible.
 Figure 5: Simulation setup in ANSYS 2D Extractor. Two copper plates of 2 by 2 inches
separated by a FR4 dielectric material with the thickness of 20 MILs. The geometry is fixed
for all the investigations.
Figure 5: Simulation setup in ANSYS 2D Extractor. Two copper plates of 2 by 2 inches
separated by a FR4 dielectric material with the thickness of 20 MILs. The geometry is fixed
for all the investigations.I used a default copper material from the library for the plates but I created a new FR4 epoxy material where the parameters from Figure 6 were used: 4.4 for ε and 0.02 for tan(δ) defined at a frequency of 1GHz, a triplet of values which you would usually get from a manufacturer. The higher transition frequency (corresponding to ωB from Figure 4) was set to 159GHz. The optional properties from the DC interval were left to default values.
 Figure 6: Djordjevic-Sarkar material characterization for FR4 material. The 4.4 value for ε
and the 0.02 for tan(δ) are defined at 1GHz and the higher transitioning frequency corner is
set to 159GHz. The DC values are left to default.
Figure 6: Djordjevic-Sarkar material characterization for FR4 material. The 4.4 value for ε
and the 0.02 for tan(δ) are defined at 1GHz and the higher transitioning frequency corner is
set to 159GHz. The DC values are left to default.Reducing a 3D design to a 2D traversal section as I present in this setup is a very powerful design trick that a simulation engineer can do because it dramatically reduces the simulation time and also gives us the opportunity to set a stricter convergence criteria for the software tool. Thanks to ANSYS adaptive meshing technology, a stricter convergence criteria such as the one of 0.2% which I used will automatically lead to a deeper mesh with more meshing elements as you can observe in Figure 7.
 Figure 7: Simulating only the 2D part of the planar capacitor enabled the use of a very
deep mesh for the structure with 96580 elements and a minimum element size of 1.37E-7
inches.
Figure 7: Simulating only the 2D part of the planar capacitor enabled the use of a very
deep mesh for the structure with 96580 elements and a minimum element size of 1.37E-7
inches.With this material defined and the geometry set, the only left thing was to investigate the variation of capacitance and conductance to verify the proper change of the dielectric constant and dissipation factor according to the simulation frequency. I defined a simulation setup in ANSYS 2D Extractor with a logarithmic frequency sweep from 10 kHz to 1000GHz. This extremely high frequency interval is however only of interest to study the Djordjevic-Sarkar material characterization algorithm and as already mentioned simulation at frequencies so high in a cvasi-static software tool should be performed only if transmission line effects are not of interest.
Dissemination and results
With the geometry and simulation setup in place I performed the frequency sweep which took approximately 30 minutes on an Intel Core i7 2.7GHz with 16GB of RAM machine. I mention that all the discussed values of C and G are referred for the whole 3D design and are obtained by multiplying the results per unit length given by 2D Extractor with the third dimension, here of 2 inches. Using Equation 3 with the default value of 4.4 for ε, 4 square inches for A and 0.020 inches for h, a value of 198 pF is obtained for capacitance. From Figure 8 where the variation with frequency of the capacitance for our structure is presented you can observe that we find this value of 198 pF at the frequency of 1GHz (marker m3), exactly where we previously defined the two figures of interest, ε and tan(δ). Also from Figure 8 you can notice that from 25 kHz and 10 GHz (markers m1 and m3) a drop of almost 20% of the capacitance occurs due to the drop in the dielectric constant of the material.
 Figure 8: Variation with frequency for the capacitance of a 2 by 2 inches planar structure with
20 MILs dielectric thichness. The value of the capacitance only matches the parallel-plate
approximation at the frequency of 1 GHz where ε and tan(δ) values were defined.
Figure 8: Variation with frequency for the capacitance of a 2 by 2 inches planar structure with
20 MILs dielectric thichness. The value of the capacitance only matches the parallel-plate
approximation at the frequency of 1 GHz where ε and tan(δ) values were defined.We are now interested to observe the variation of the dielectric constant with frequency. ε is not by default included in the result set provided by 2D Extractor but can be easily obtained from the parallel plate approximation from Equation 3, where the geometric aspect ratio A/h and the vacuum permittivity are known. This is the reason why I specifically choose a large structure of 2 by 2 inches to be able to accurately use the parallel-plate approximation for the capacitance. The dielectric constant variation with frequency is therefore displayed in Figure 9. You can observe that the simulation is in accordance with the analytical calculations performed in the final part of Section "Material and methods" using Equations 8, 9 and 10: Δε is 0.80 (delta markers between m2 and m1) with ε dropping from 4.95 in the DC interval to 4.15 in the optical interval. The lower transition frequency is close to the one of 23.29 kHz analytically obtained.
 Figure 9: ε variation with frequency in a large interval from 10Hz to 1000GHz. Markers are
set to the lower and higher transitioning frequencies and to 1GHz where ε value was defined.
Figure 9: ε variation with frequency in a large interval from 10Hz to 1000GHz. Markers are
set to the lower and higher transitioning frequencies and to 1GHz where ε value was defined.The dissipation factor is also not by default included in a result set by 2D Extractor but its variation with frequency can easily be obtained from Equation 4 where both G and C are provided by the simulator and ω = 2·π·f. You can observe in Figure 10 that the dissipation factor has a variation in accordance with our expectations, with a constant value around the measurement frequency of 1 GHz (marker m1).
 Figure 10: tan(δ) variation with frequency in a large interval from 10Hz to 1000GHz. A
marker is set to 1GHz where tan(δ) value was defined.
Figure 10: tan(δ) variation with frequency in a large interval from 10Hz to 1000GHz. A
marker is set to 1GHz where tan(δ) value was defined.Conclusion
The dielectric constant of a material is expressed as a complex number with a real and imaginary part, the imaginary describing the losses in the dielectric material (currrent in phase with voltage, a parasitic, not desired effect). In practical applications the real part of this complex number is usually named dielectric constant or ε along with the tangent of the angle between the complex number and the abscissa, tan(δ).
In this article I briefly presented the leading molecular effects that cause the variation with frequency of the dielectric constant and the dissipation factor of a material. The dipole polarization is the one that influences the most in the hundreds of kHz to GHz range the dielectric properties of a material. Due to this cause and some others, ε drops from a DC value to an optical one in the range from kHz to GHz, while tan(δ) is slightly influenced with a almost constant value in this transition interval.
Even for simple analytical approximations of capacitance, a correct value for your dielectric constant is always important. This is where the Djordjevic-Sarkar algorithm intervenes, a method also used by ANSYS software tools to predict the variation of this figures of interest for a dielectric. This method is based on a paper published in IEEE Transactions on Electromagnetic Compatibility in 2001 by Antonije R. Djordjevic and Tapan K. Sarkar [1].
Manufactures will mainly give only one measured set of parameters ε and tan(δ) at a specific measurement frequency. I also presented in this article the main equations used by the Djordjevic-Sarkar algorithm to estimate the variation of these two parameters with frequency and also what are the input data needed, both mandatory and optional, to make a prediction.
Lastly, important characterization of the materials used in a design is extremely necessary, since as discussed in this article almost a variation of 20% in capacitance can occur from one corner value of the dielectric constant to another one. A small difference such as this one between simply a guess and a correctly estimation might convert into a failure or a success of your circuit board design.